Storage is one of the most important components when it comes to performance in the case of upgrading or buying a computer. Two powerful storage devices Solid State Drives (SSD) and Hard Disk Drives (HDD) have significant differences in speed and efficiency, durability, and realistic performance. Although the dominant users realize that SSDs are fast, the actual difference can be seen only by looking at the performance benchmarks.
This step-by-step examination of the distinctions between SSD and HDD performance benchmarks, which can be divided into synthetic benchmarks, real-world benchmarks, and workload-based benchmarks. This article will enable you to know what the benchmark numbers mean and how it can be translated into real-life performance, regardless of you being a casual user, gamer, a content creator or an IT professional.
Table of Contents
Learning about Storage Performance Benchmarks
The benchmarks refer to standardized tests which are intended to evaluate the performance of the hardware components within controlled conditions.
Storage Benchmarks: What Measures
- Data transfer speeds
- I/O operations per second IOPS.
- Latency and response time
- Random vs sequential access performance.
- Prolonged vs short-term performance.
Why Benchmarks Matter
| Reason | Explanation |
| Objective comparison | Provides measurable performance data |
| Buying decisions | Helps choose the right storage type |
| Workload matching | Aligns hardware with use cases |
| Performance tuning | Identifies bottlenecks |
Benchmarks remove subjective impressions and replace them with measurable evidence.
Basic Technology Differences Between SSD and HDD
Understanding how SSDs and HDDs work is essential before analyzing their benchmark results.
HDD (Hard Disk Drive) Overview
- Uses spinning magnetic platters
- Mechanical read/write heads
- Data access depends on physical movement
SSD (Solid State Drive) Overview
- Uses NAND flash memory
- No moving parts
- Data accessed electronically
Core Technology Comparison
| Feature | HDD | SSD |
| Moving parts | Yes | No |
| Data access method | Mechanical | Electronic |
| Noise | Audible | Silent |
| Heat generation | Higher | Lower |
These architectural differences are the primary reason benchmark results vary so dramatically.
Types of SSDs and HDDs Used in Benchmarks
Not all SSDs or HDDs perform the same.
SSD Categories
| SSD Type | Interface | Typical Use |
| SATA SSD | SATA III | Budget upgrades |
| NVMe SSD | PCIe | High-performance systems |
| M.2 SSD | SATA or PCIe | Compact devices |
HDD Categories
| HDD Type | RPM | Use Case |
| 5400 RPM | Low | Laptops, storage |
| 7200 RPM | Medium | Desktops |
| Enterprise HDD | High | Servers, NAS |
Benchmark results vary significantly depending on the specific drive type.
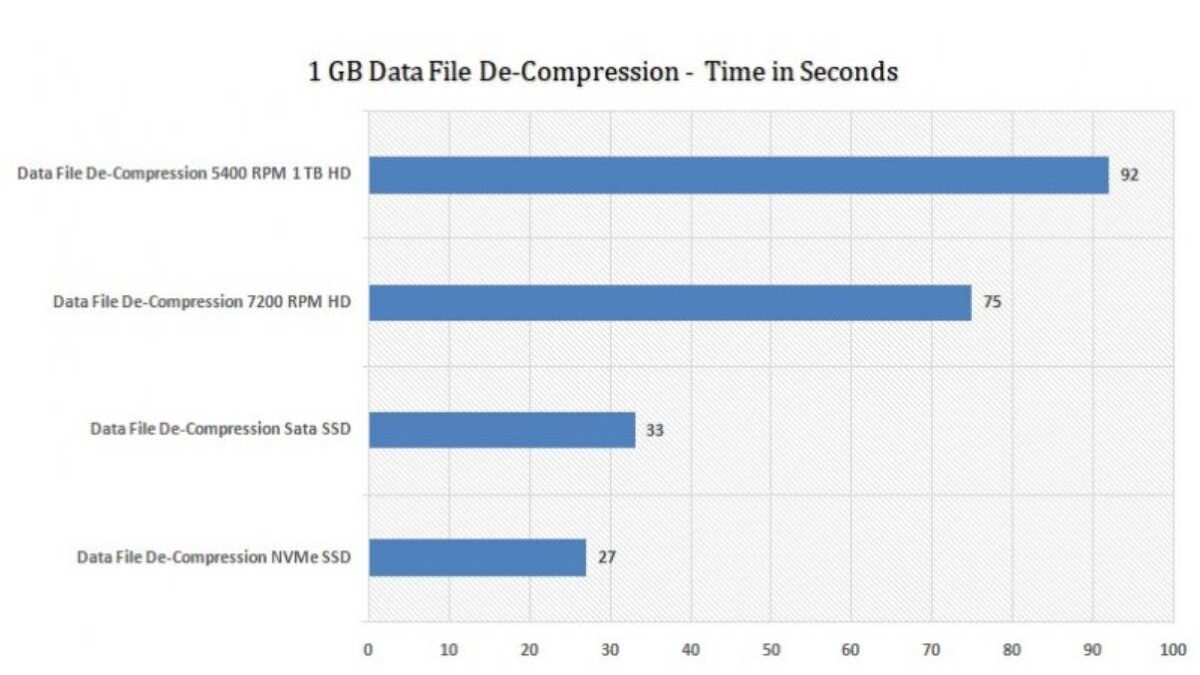
Sequential Read and Write Performance Benchmarks
Sequential performance measures how fast large, continuous blocks of data are read or written.
Typical Sequential Benchmark Results
| Storage Type | Read Speed (MB/s) | Write Speed (MB/s) |
| HDD (7200 RPM) | 80–160 | 80–150 |
| SATA SSD | 450–550 | 400–520 |
| NVMe SSD | 2,000–7,000 | 1,500–6,500 |
Interpretation
- HDDs are bottlenecked by platter rotation speed
- SATA SSDs max out at interface limits
- NVMe SSDs leverage PCIe bandwidth
Sequential benchmarks are most relevant for file transfers, video editing, and backups.
Random Read and Write Performance Benchmarks
Random access benchmarks measure performance when accessing small, scattered data blocks.
Random Performance Comparison
| Storage Type | Random Read (IOPS) | Random Write (IOPS) |
| HDD | 100–200 | 100–150 |
| SATA SSD | 50,000–100,000 | 40,000–90,000 |
| NVMe SSD | 300,000–1,000,000+ | 250,000–900,000 |
Why Random Performance Matters
- OS boot times
- Application launching
- Database operations
- Multitasking workloads
This is where SSDs show the most dramatic advantage over HDDs.
Latency and Response Time Benchmarks
Latency measures how quickly a drive responds to a request.
Average Latency Comparison
| Storage Type | Latency |
| HDD | 5–15 ms |
| SATA SSD | 0.05–0.1 ms |
| NVMe SSD | 0.01–0.03 ms |
Lower latency results in faster system responsiveness and smoother user experience.
Boot Time Benchmarks: SSD vs HDD
Boot time is one of the most noticeable real-world differences.
Typical Boot Time Results
| Storage | Boot Time |
| HDD | 30–90 seconds |
| SATA SSD | 10–20 seconds |
| NVMe SSD | 5–10 seconds |
Benchmarks consistently show SSDs booting systems several times faster than HDDs.
Application Load Time Benchmarks
Loading applications involves multiple small file reads, favoring SSDs.
App Launch Benchmark Comparison
| Application Type | HDD | SSD |
| Web browser | Slow | Instant |
| Office apps | Moderate | Fast |
| IDEs | Very slow | Very fast |
| Games | Long loading screens | Short loading screens |
This performance gain is primarily driven by superior random read speeds.
Gaming Performance Benchmarks
While storage does not directly affect FPS, it impacts loading times and asset streaming.
Gaming Storage Benchmark Results
| Metric | HDD | SSD |
| Game load time | Long | Short |
| Texture pop-in | Frequent | Rare |
| Open-world streaming | Slower | Faster |
Modern games increasingly benefit from SSDs, especially NVMe drives.
File Transfer Benchmarks
File transfer tests measure how quickly data moves between storage devices.
Large File Transfer Results
| Storage | 10GB File Transfer |
| HDD | 1–2 minutes |
| SATA SSD | 20–30 seconds |
| NVMe SSD | 5–10 seconds |
These benchmarks are crucial for video editors and data professionals.
Multitasking and Queue Depth Benchmarks
Queue depth measures how well a drive handles multiple simultaneous requests.
Queue Depth Performance
| Storage | QD1 Performance | QD32 Performance |
| HDD | Poor | Very poor |
| SATA SSD | Good | Very good |
| NVMe SSD | Excellent | Outstanding |
High queue depth performance is essential for servers and heavy multitasking.
Power Consumption and Efficiency Benchmarks
Power efficiency affects battery life and thermal performance.
Power Usage Comparison
| Storage | Idle Power | Active Power |
| HDD | High | Very high |
| SSD | Very low | Low |
SSDs are significantly more power-efficient, making them ideal for laptops.
Heat and Thermal Throttling Benchmarks
Thermal performance influences sustained speeds.
Thermal Characteristics
| Storage | Heat Output | Throttling Risk |
| HDD | Moderate | Low |
| SATA SSD | Low | Very low |
| NVMe SSD | High | Medium |
High-end NVMe SSDs may throttle under sustained heavy loads without cooling.
Reliability and Durability Benchmarks
Performance also includes reliability under stress.
Durability Metrics
| Metric | HDD | SSD |
| Shock resistance | Low | High |
| MTBF | Moderate | High |
| Wear limits | None | Write cycles |
While SSDs have write limits, modern drives last many years under normal use.
Benchmark Tools Used for SSD and HDD Comparison
Popular Benchmarking Tools
| Tool | Focus |
| CrystalDiskMark | Read/write speed |
| ATTO Disk Benchmark | Sequential performance |
| AS SSD Benchmark | Real-world simulation |
| PCMark Storage | Application workloads |
Using multiple tools provides a balanced performance picture.
Real-World vs Synthetic Benchmark Differences
Synthetic benchmarks do not always reflect real usage.
Key Differences
| Aspect | Synthetic | Real-World |
| Environment | Controlled | Variable |
| Workload | Isolated | Mixed |
| Predictability | High | Moderate |
A combination of both is ideal for informed decisions.
SSD vs HDD Benchmarks for Different Use Cases
Best Storage by Use Case
| Use Case | Recommended Storage |
| Office work | SATA SSD |
| Gaming | SSD or NVMe |
| Video editing | NVMe SSD |
| Bulk storage | HDD |
| Servers | NVMe SSD |
Benchmarks clearly show SSDs outperform HDDs in almost every active workload.
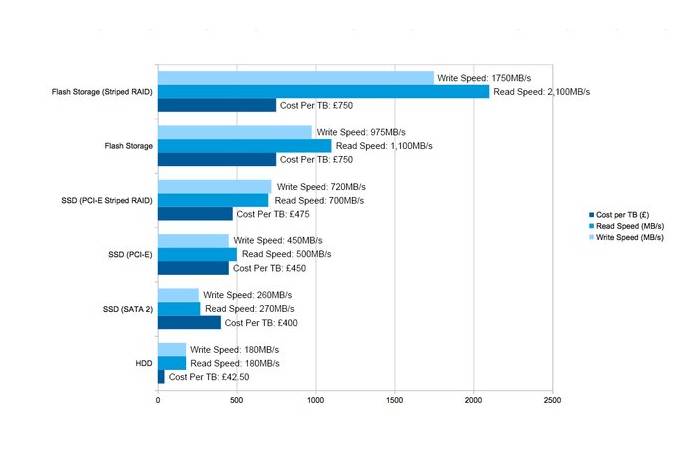
Cost per Performance Analysis
Price still plays a role in storage decisions.
Cost Comparison
| Storage | Cost per GB | Performance |
| HDD | Low | Low |
| SATA SSD | Medium | High |
| NVMe SSD | Higher | Very high |
HDDs remain relevant for large, low-cost storage needs.
Common Misinterpretations of Benchmarks
| Misconception | Reality |
| Higher MB/s means better overall | Random speed matters more |
| SSD improves FPS | Affects load times only |
| All SSDs perform the same | Interface matters |
Understanding benchmarks prevents poor buying decisions.
Future Trends in Storage Performance
Emerging Developments
- PCIe 5.0 SSDs
- DirectStorage optimization
- QLC and PLC NAND improvements
- Hybrid storage solutions
Benchmark gaps between SSDs and HDDs will continue to widen.
Final Thoughts
The performance benchmark of both SSD and HDD is significant and can be determined in relation to almost all metrics. Sequential and random speeds, latency, booting time, and multitasking capabilities, SSDs are always way ahead of the HDDs. HDDs however still find applications in low cost bulk storage where speed is not a major concern.
Through the knowledge of benchmark data instead of marketing claims, users are able to make informed decisions on the basis of their real needs. At the same time, regardless of whether the old system is undergoing an upgrade or a new system is under construction, performance benchmarks have most certainly demonstrated the reason why SSDs have assumed the role the new standard of modern computing.