Google Analytics 4 (GA4) gives small businesses access to enterprise-level data — but only if you know which KPIs actually matter. Most small teams don’t fail because of missing data; they fail because they track too many metrics and too few outcomes.
This guide breaks down the 12 most important GA4 KPIs for small businesses, with simple explanations and where to find each one inside GA4. It’s designed to complement your broader KPI strategy and plug directly into your marketing and SEO reporting dashboards.
Table of Contents
What Are GA4 KPIs vs Metrics?
A metric is any measurable data point in GA4 (sessions, clicks, scrolls). A GA4 KPIs guide for small businesses is a metric that directly reflects business success.
For small businesses, the goal is not more data — it’s a shortlist of KPIs that answer three questions:
- Are people finding us?
- Are they engaging?
- Are they converting?
Everything else is secondary.
Essential GA4 KPIs for Website Traffic
These KPIs tell you whether your website and content are attracting and holding attention.
1. Users
What it tells you: How many unique people visited your site.
Where to find it:
Reports → Acquisition → Traffic acquisition
2. Sessions
What it tells you: How often users interact with your site in a given period.
Where to find it:
Reports → Acquisition → Traffic acquisition
3. Engaged Sessions
What it tells you: Sessions lasting 10+ seconds, with 2+ page views or a conversion.
This is a stronger signal of quality traffic than sessions alone.
Where to find it:
Reports → Engagement → Overview
4. Engagement Rate
What it tells you: Percentage of sessions that were engaged (GA4’s replacement for bounce rate).
Where to find it:
Reports → Engagement → Pages and screens
5. Average Engagement Time
What it tells you: How long users actively interact with your content.
Useful for evaluating blog posts, landing pages, and service pages.
Where to find it:
Reports → Engagement → Pages and screens
Conversion KPIs to Track Leads and Sales
Traffic alone doesn’t grow a business. These KPIs measure outcomes.
6. Conversions
What it tells you: How many times users completed key actions (leads, purchases, sign-ups).
In GA4, conversions are events you manually mark as important.
Where to find it:
Reports → Engagement → Events
7. Conversion Rate
What it tells you: Percentage of users or sessions that convert.
This KPI highlights landing page and funnel effectiveness.
Where to find it:
Reports → Acquisition → Traffic acquisition
8. Form Submissions / Lead Events
What it tells you: How many inbound leads your site generates.
Typically tracked via events like generate_lead or thank-you page views.
Where to find it:
Reports → Engagement → Events
9. Revenue (for Ecommerce)
What it tells you: Direct income generated from your website.
Only applicable if ecommerce tracking is enabled.
Where to find it:
Reports → Monetization → Ecommerce purchases
Channel Performance KPIs (SEO, Ads, Email)
These KPIs help you understand which channels actually drive results.
10. Traffic by Channel
What it tells you: Where your users come from (organic search, paid ads, email, social).
Essential for SEO and campaign evaluation.
Where to find it:
Reports → Acquisition → Traffic acquisition
11. Cost per Lead / Cost per Acquisition (CPL / CPA)
What it tells you: How efficiently paid channels generate leads or customers.
Requires Google Ads or campaign cost data integration.
Where to find it:
Reports → Acquisition → Traffic acquisition (with cost metrics enabled)
12. Return on Ad Spend (ROAS) / ROI
What it tells you: Revenue generated compared to advertising spend.
Critical for scaling paid campaigns responsibly.
Where to find it:
Reports → Advertising → Attribution
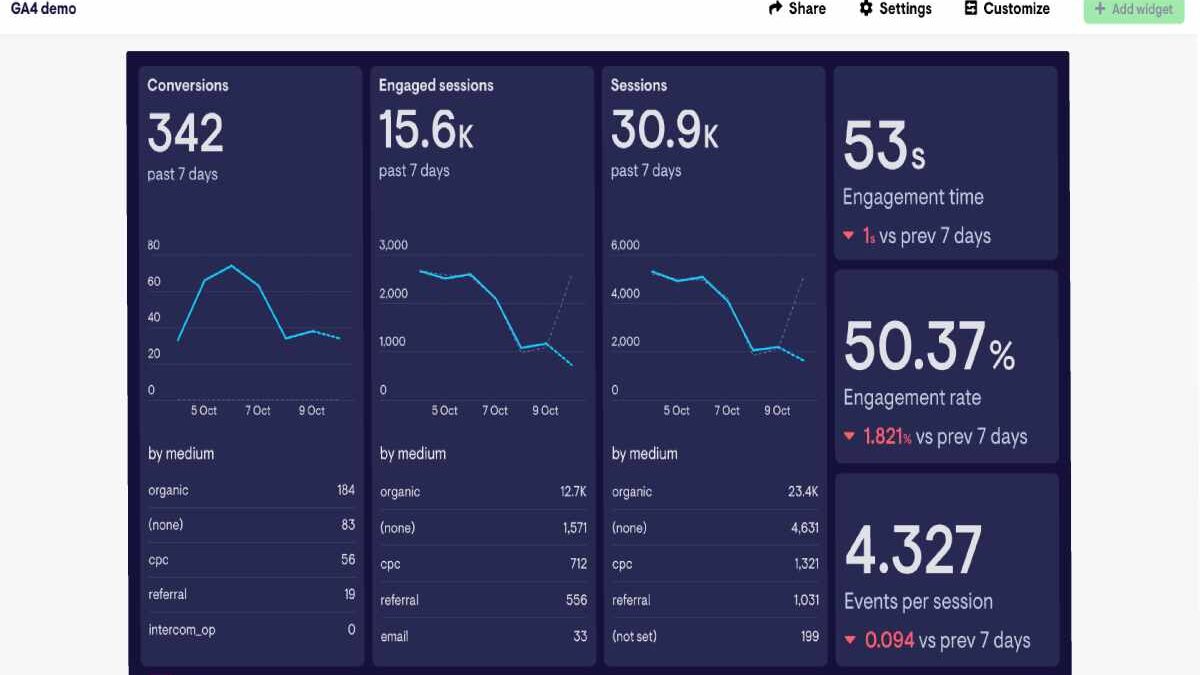
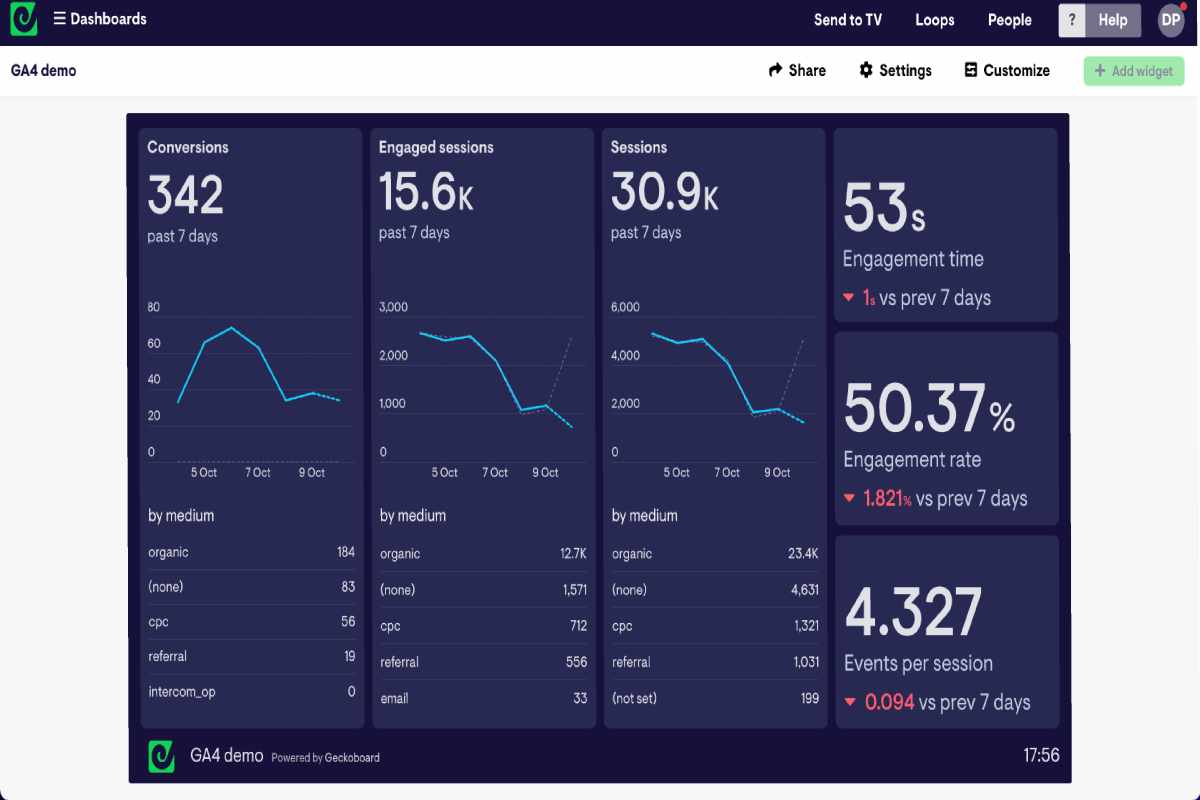
How to Turn GA4 KPIs into a Simple Dashboard
GA4 is your data source — not your final reporting layer.
Most small businesses benefit from:
- A GA4 overview report for quick checks
- A Looker Studio dashboard combining GA4, Search Console, and ads data
Core GA4 KPIs to include in your dashboard:
- Users and engaged sessions
- Conversions and conversion rate
- Revenue or lead volume
- Performance by channel
These KPIs feed directly into a unified reporting system, as outlined in the SEO reporting dashboard guide, and align with the broader framework in your Digital Marketing KPIs & Email Strategy pillar.
For teams thinking about long-term scalability, this also fits into a wider technology-for-business stack approach — where analytics, dashboards, and automation work together.
Final Takeaway
Small businesses don’t need dozens of GA4 metrics. They need 12 clear KPIs that show:
- Growth
- Engagement quality
- Conversion performance
- Channel efficiency
Track these consistently, review them monthly, and connect them to a simple dashboard. That’s how GA4 becomes a decision-making tool — not just another analytics platform.